DayPilot
| Demo | |
|---|---|
| Downloads | |
| Languages | TypeScript |
| Technologies | angular |
Overview
-
Excel export is a feature of the Angular Scheduler component (it’s available since 2025.1.6418).
-
Time headers and row headers are frozen in the exported spreadsheet.
-
You can add custom rows to the frozen headers using the frozen rows feature.
-
The project includes a trial version of DayPilot Pro for JavaScript (see License below).
License
Licensed for testing and evaluation purposes. Please see the license agreement included in the sample project. You can use the source code of the tutorial if you are a licensed user of DayPilot Pro for JavaScript. Buy a license.
Setup
Install DayPilot Pro:
npm install https://npm.daypilot.org/daypilot-pro-angular/trial/2026.4.7110.tar.gzInstall ExcelJS:
npm install exceljsExcelJS is used by the Scheduler to generate the Excel XLSX file.
It is necessary to pass the reference to the ExcelJS object to the Scheduler using the exceljs property:
import ExcelJS from 'exceljs';
// ...

export class SchedulerComponent implements AfterViewInit {
  // ...

  config = signal<DayPilot.SchedulerConfig>({
    // ...
    exceljs: ExcelJS,
    // ...
  });

  // ...
}
The standalone Angular component stores its configuration and event data in signals. Bind those signals directly using [config]="config" and [events]="events"; use config.update() and events.set() when loading resources and events.
Now it is possible to export the visual representation of the Scheduler component to an Excel file using the exportAs() method.
Frozen Headers in the Exported Excel Spreadsheet
The Excel screenshots below use October 2025 sample dates; the downloadable project uses October 2026 with the same frozen-header behavior.
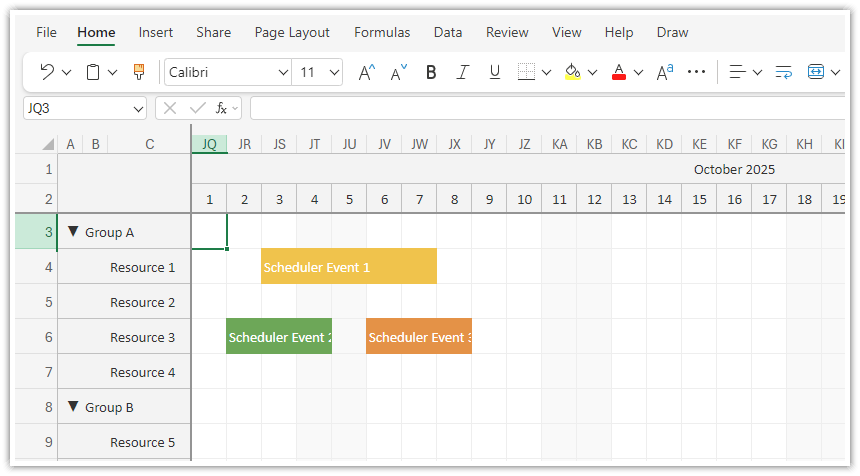
When you set the Scheduler export area to "full", the Scheduler freezes the headers (both vertical and horizontal) in the output spreadsheet.
exportToExcel(): void {
  const options = {
    area: "full"
  };
  this.scheduler.control.exportAs("xlsx", options).download(this.filename || "scheduler.xlsx");
}
The full export includes the entire timeline, even when only part of it is visible in the browser. The spreadsheet’s initial scroll position matches the current Scheduler viewport, so opening the file shows the same dates while keeping the headers visible. In this sample, the timeline covers 2026 and the Scheduler initially scrolls to October 1.
Add Rows to the Frozen Headers
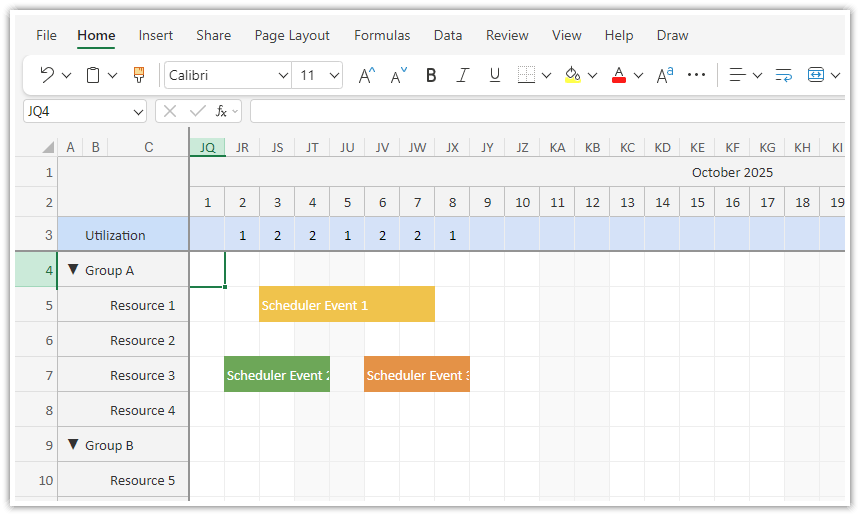
The Angular Scheduler component supports freezing select rows (representing resources) at the top or bottom of the grid.
The rows frozen at the top will be included in the frozen header in the exported XLSX file as well.
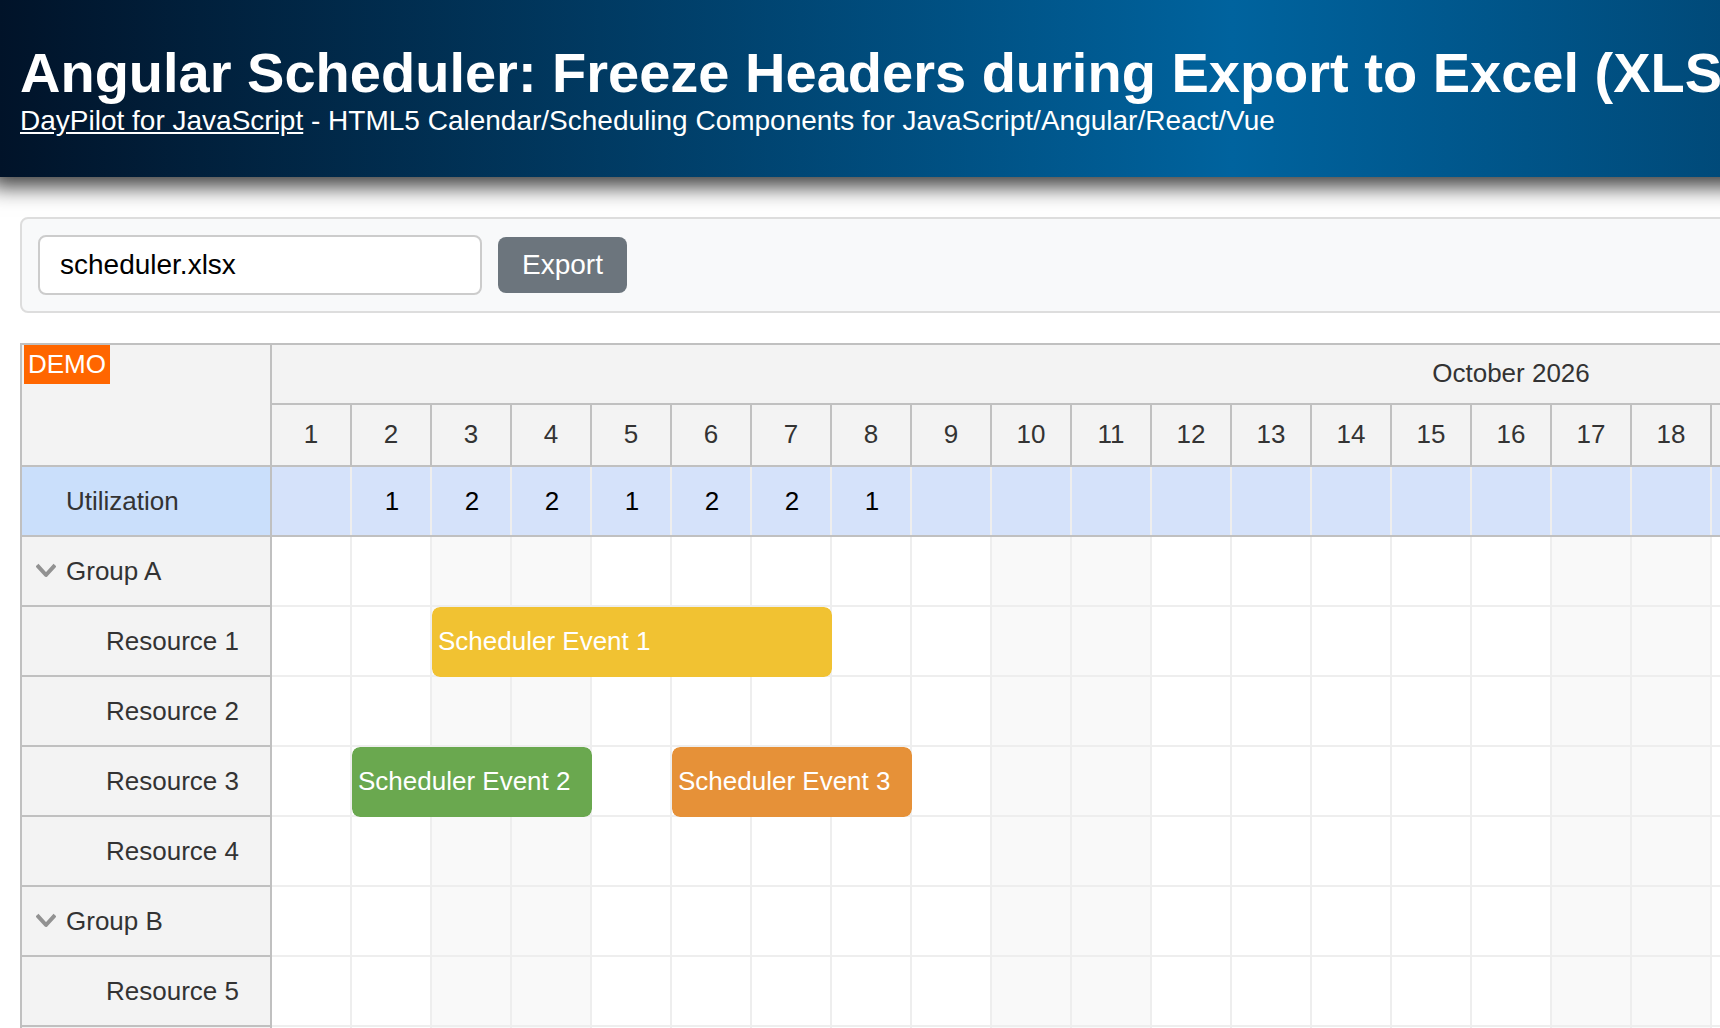
In our Angular project, we define a special frozen row that will display the utilization summary:
resources: DayPilot.ResourceData[] = [
  {
    name: "Utilization", id: "summary", frozen: "top", cellsAutoUpdated: true
  },
  {
    name: 'Group A', id: 'GA', expanded: true, children: [
      {name: 'Resource 1', id: 'R1', capacity: 10},
      {name: 'Resource 2', id: 'R2', capacity: 30},
      {name: 'Resource 3', id: 'R3', capacity: 20},
      {name: 'Resource 4', id: 'R4', capacity: 40}
    ]
  },
  {
    name: 'Group B', id: 'GB', expanded: true, children: [
      {name: 'Resource 5', id: 'R5', capacity: 20},
      {name: 'Resource 6', id: 'R6', capacity: 40},
      {name: 'Resource 7', id: 'R7', capacity: 20},
      {name: 'Resource 8', id: 'R8', capacity: 40}
    ]
  }
];
This row will display the total number of events for each time slot. The cellsAutoUpdated flag keeps the totals up to date when events are added, moved, or resized:
onBeforeCellRender: args => {
  if (args.cell.resource === "summary") {
    const total = args.control.events.forRange(args.cell.start, args.cell.end);
    if (total.length > 0) {
      args.cell.properties.text = `${total.length}`;
    } else {
      args.cell.properties.text = "";
    }
    args.cell.properties.verticalAlignment = "center";
    args.cell.properties.horizontalAlignment = "center";
    args.cell.properties.backColor = "#d5e2fa";
  }
},
To highlight the frozen row and make clear that it has a special purpose, the handler also sets a custom background color for the grid cells. We use a similar color for the row header:
onBeforeRowHeaderRender: args => {
  if (args.row.id === "summary") {
    args.row.backColor = "#cadffb";
  }
},
Full Source Code
Here is the full source of our Angular application that exports the Scheduler view to an Excel file (XLSX):
import {Component, ViewChild, AfterViewInit, signal} from '@angular/core';
import {DayPilot, DayPilotModule, DayPilotSchedulerComponent} from 'daypilot-pro-angular';
import {DataService, ExtendedEventData} from './data.service';
import ExcelJS from 'exceljs';
import {FormsModule} from '@angular/forms';

@Component({
  selector: 'scheduler-component',
  standalone: true,
  imports: [DayPilotModule, FormsModule],
  providers: [DataService],
  template: `
    <div class="toolbar">
      <input aria-label="Filename" type="text" placeholder="Filename" [(ngModel)]="filename" />
      <button (click)="exportToExcel()">Export</button>
    </div>
    <daypilot-scheduler [config]="config" [events]="events" #scheduler></daypilot-scheduler>
  `,
  styles: [`
    .toolbar {
      display: flex;
      align-items: center;
      padding: 8px;
      margin-bottom: 15px;
      background-color: #f8f9fa;
      border: 1px solid #ddd;
      border-radius: 4px;
    }

    .toolbar input[type="text"] {
      margin-right: 8px;
      padding: 6px 10px;
      border: 1px solid #ccc;
      border-radius: 4px;
      font-size: 14px;
      width: 200px;
    }

    .toolbar button {
      padding: 6px 12px;
      background-color: #6c757d;
      color: #ffffff;
      border: none;
      border-radius: 4px;
      font-size: 14px;
      cursor: pointer;
      transition: background-color 0.3s ease;
    }

    .toolbar button:hover {
      background-color: #5a6268;
    }
  `]
})
export class SchedulerComponent implements AfterViewInit {

  filename: string = "scheduler.xlsx";

  @ViewChild('scheduler')
  scheduler!: DayPilotSchedulerComponent;

  events = signal<DayPilot.EventData[]>([]);

  config = signal<DayPilot.SchedulerConfig>({
    timeHeaders: [{"groupBy":"Month"},{"groupBy":"Day","format":"d"}],
    scale: "Day",
    days: 365,
    startDate: "2026-01-01",
    durationBarVisible: false,
    onTimeRangeSelected: async (args) => {
      const scheduler = args.control;
      const modal = await DayPilot.Modal.prompt("Create a new event:", "Event 1");
      scheduler.clearSelection();
      if (modal.canceled) { return; }
      scheduler.events.add({
        start: args.start,
        end: args.end,
        id: DayPilot.guid(),
        resource: args.resource,
        text: modal.result
      });
      this.events.set([...scheduler.events.list]);
    },
    eventMoveHandling: "Update",
    eventResizeHandling: "Update",
    onEventMoved: args => this.events.set([...args.control.events.list]),
    onEventResized: args => this.events.set([...args.control.events.list]),
    treeEnabled: true,
    exceljs: ExcelJS,
    onBeforeRowHeaderRender: args => {
      if (args.row.id === "summary") {
        args.row.backColor = "#cadffb";
      }
    },
    onBeforeCellRender: args => {
      if (args.cell.resource === "summary") {
        const total = args.control.events.forRange(args.cell.start, args.cell.end);
        if (total.length > 0) {
          args.cell.properties.text = `${total.length}`;
        } else {
          args.cell.properties.text = "";
        }
        args.cell.properties.verticalAlignment = "center";
        args.cell.properties.horizontalAlignment = "center";
        args.cell.properties.backColor = "#d5e2fa";
      }
    },
    onBeforeEventRender: args => {
      const data = <ExtendedEventData>args.data;
      args.data.backColor = data.color;
      args.data.borderColor = data.color;
      args.data.fontColor = "#ffffff";
    }
  });

  constructor(private ds: DataService) {
  }

  ngAfterViewInit(): void {
    this.ds.getResources().subscribe(result => {
      this.config.update(config => ({...config, resources: result}));
    });

    this.scheduler.control.scrollTo("2026-10-01");

    const from = this.scheduler.control.visibleStart();
    const to = this.scheduler.control.visibleEnd();
    this.ds.getEvents(from, to).subscribe(result => {
      this.events.set(result);
    });
  }

  exportToExcel(): void {
    const options = {
      area: "full"
    };
    this.scheduler.control.exportAs("xlsx", options).download(this.filename || "scheduler.xlsx");
  }

}
You can download the full project using the link at the top of this tutorial.